Bảng điều khiển bán hàng – Trực quan hóa dữ liệu bán hàng – 32 ví dụ và triển khai bảng điều khiển
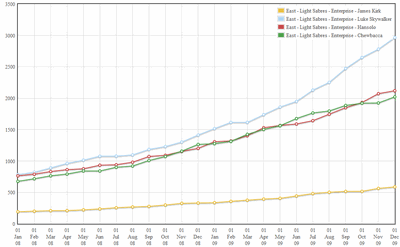
Javascript based Sales Dashboard by Ahmad (Option 01)
larger version |
My Comments:
- Dynamic dashboard, lets user choose the dimensions of data and shows sales performance immediately.
- Easy to compare performance of various criteria, can get too cluttered if you add several dimensions.
- Uses Javascript, thus runs in most web browsers
|
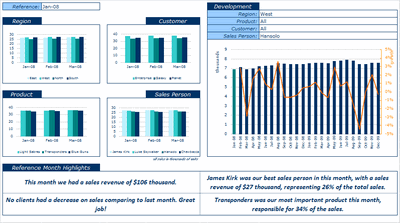
Excel based Sales Dashboard by Aires (Option 02)
larger version |
My Comments:
- Shows analysis of “selected month” along with next 23 months.
- Includes a tweetboard for easy interpretation and key messages.
- Shows the growth rate of sales (derived metric)
|
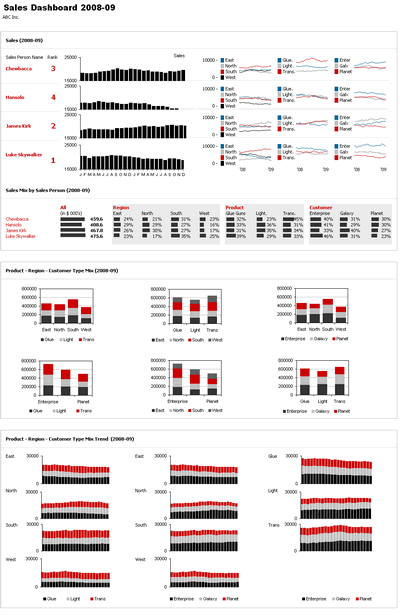
Excel based Sales Dashboard by Ajay (Option 03)
larger version |
My Comments:
- Analysis of sales data by “sales person” shown very clearly.
- Aesthetically pleasing design, fewer colors and options to reduce confusion. Good use of sparklines.
- Stacked charts could use some improvement as they are difficult to read or compare.
|
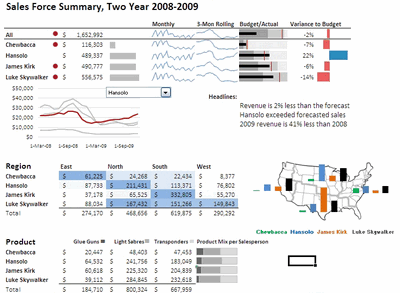
Excel based Sales Dashboard by Alex Kerin (Option 04)
larger version |
My Comments:
- Very good use of incell charts and sparklines (addin from Fabrice).
- Shows derived metrics like 3 months rolling sales. Also, uses a real map to show region-wise performance.
- Good use of tables with conditional formatting (also, headlines clearly call for attention).
|
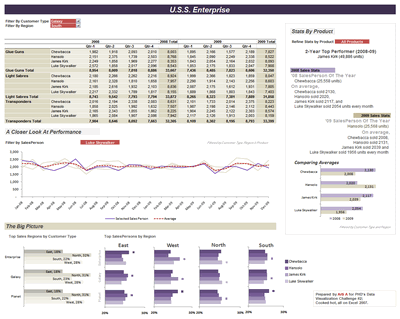
Excel based Sales Dashboard by Arti (Option 05)
larger version |
My Comments:
- Dynamic dashboard, lets you compare sales by customer type or region or sales person. Also, compares values with averages.
- Good mix of charts for selected data along with big-picture. Also, includes clear headlines and messages (like “2008 sales person of the year is Chewbacca”).
- Fewer colors and objects, easy to read the dashboard.
|
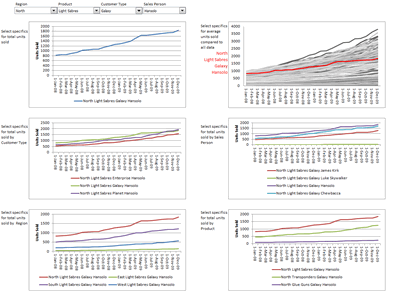
Excel based Sales Dashboard by Cole Burdette (Option 06)
larger version |
My Comments:
- Lets you compare one combination of sales data like Sales in North region for product light sabres to the customer “galaxy” by sales person “hansolo” with all other possible values.
- Fewer charts thus easy to read without getting lost.
- Could use some formatting better color choices. Also, shows only trends, not much on current month’s data.
|
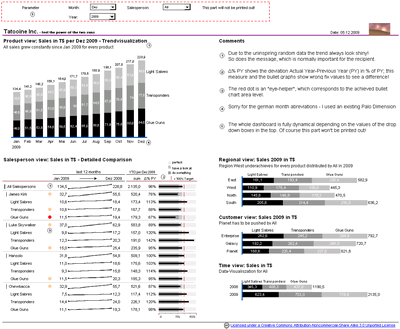
Excel-Palo based Sales Dashboard by Cuboo (Option 07)
larger version |
My Comments:
- Dynamic dashboard with option to select month and sales person. Shows historic data for last 12 months.
- Clever use of incell sparklines and bullet charts to show performance of product by sales person.
- Includes clear comments (headlines). Fewer objects, so easy to read. Also, has data labels and other chart elements to help us read the findings.
|
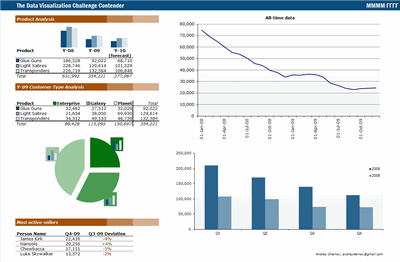
Excel based Sales Dashboard by Duezzz (Option 08)
larger version |
My Comments:
- Shows overall sales trend along with 2009 summary
- Analysis by customer type and product.
- Uses pie charts to show product composition in sales.
|
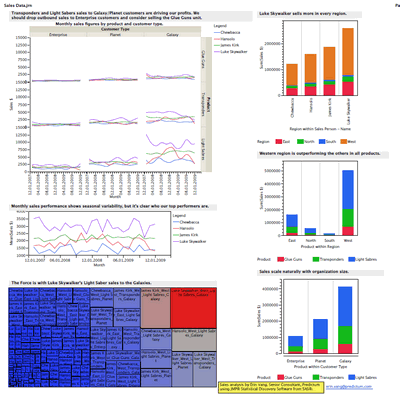
Jmp based Sales Dashboard by Erin Vang (Option 09)
larger version |
My Comments:
- Very rich dashboard presentation – thanks to JMP. Shows trends using panel charts (of lines).
- Includes 3 summary charts to prove points (like Luke sells more than others etc.)
- Interesting treemap style of visualization.
|
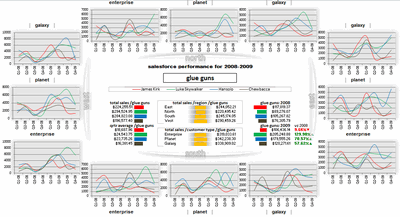
Excel based Sales Dashboard by Esteban (Option 10)
larger version |
My Comments:
- Very good placement of charts – uses the natural positions of regions (north, east, south and west)
- Cleve use of incell charts (using REPT formula)
- Dynamic dashboard – user can select one of the products.
|
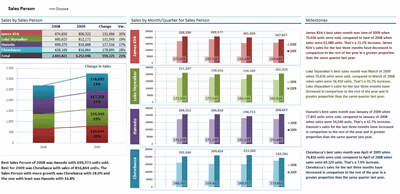
Excel based Sales Dashboard by Hernan (Option 11)
larger version |
My Comments:
- Clear layout with charts at yearly level and qtrly level. Fewer colors and easy to read.
- Includes headlines (key messages) by sales person. Very useful to understand the performance of sales persons.
- Provides analysis only from sales person point of view.
|
Excel based Sales Dashboard by Karimmo (Option 12)
larger version |
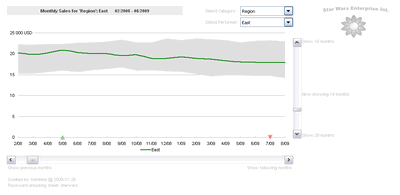
My Comments:
- Dynamic dashboard with option to select dimension and metrics along with time frame for reporting.
- Shows overall distribution along with chart for selected option. Easy to compare how the selection is doing wrt others.
- Could use some more charts.
|
Excel based Sales Dashboard by Karimmo (Option 13)
larger version |
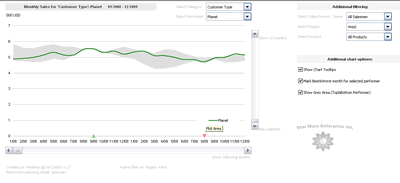
My Comments:
- Dynamic dashboard with option to select dimension and metrics along with time frame for reporting.
- Has additional filtering options.
- Could use some more charts.
|
Excel based Sales Dashboard by Karimmo (Option 14)
larger version |
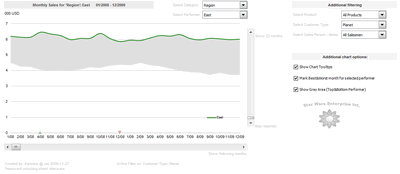
My Comments:
- Dynamic dashboard with option to select dimension and metrics along with time frame for reporting.
- Has additional filtering options.
- Could use some more charts.
|
Excel based Sales Dashboard by Karimmo (Option 15)
larger version |
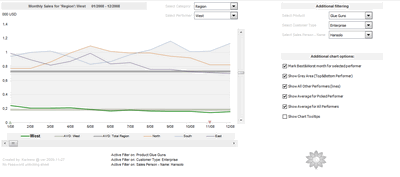
My Comments:
- Dynamic dashboard with option to select dimension and metrics along with time frame for reporting.
- Has additional filtering options and shows additional charts on demand. Provides instant comparison of selected option against other data.
- Very cleaver use of form controls.
|
Excel based Sales Dashboard by Karimmo (Option 16)
larger version |
My Comments:
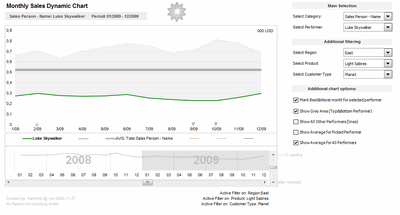
- Dynamic dashboard with option to select dimension and metrics along with time frame for reporting.
- Has additional filtering options and shows additional charts on demand. Provides instant comparison of selected option against other data.
- Very cleaver use of form controls.
|
Excel based Sales Dashboard by Leandro (Option 17)
larger version |
My Comments:
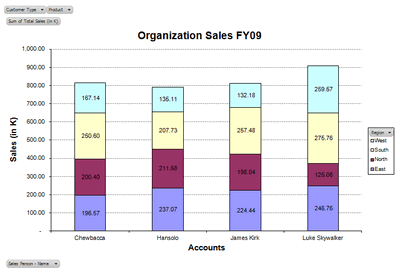
- Very good use of pivot charts to make dynamic chart
- One chart to rule them all.
- Could use some variety and trickery.
|
Excel based Sales Dashboard by Lee (Option 18)
larger version |
My Comments:
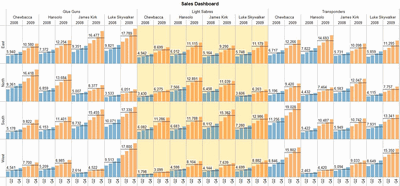
- Simple and intuitive dashboard design. Fewer colors and better formatting. Very easy to read.
- Includes average lines to provide instant comparison.
- Could include some messages so that it is easy to scan the report to establish them.
|
Excelcius based Sales Dashboard by Mahesh (Option 19)
larger version |
My Comments:
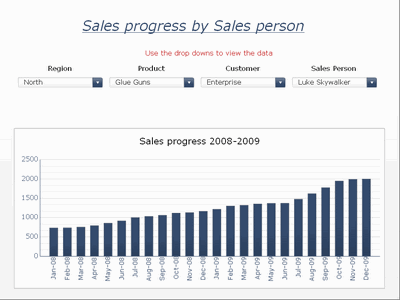
- Uses Excelcius to show chart by selected options.
- Simple chart options, easy to read and understand.
- Could use some more charts.
|
Excel based Sales Dashboard by Mahesh (Option 20)
larger version |
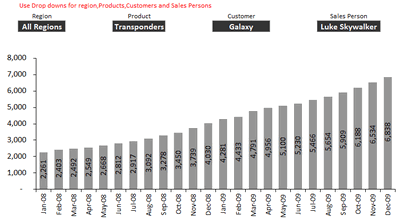
My Comments:
- Uses Excel to show chart by selected options.
- Simple chart options, easy to read and understand.
- Could use some more charts.
|
Excel based Sales Dashboard by Mahesh (Option 21)
larger version |
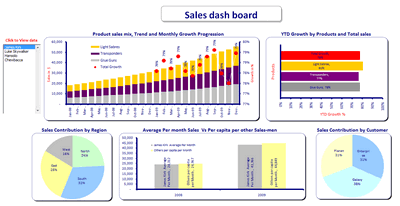
My Comments:
- Dynamic dashboard with ability to select a sales person to see their performance.
- Uses combo charts to show sales along with growth rates.
- Could use better formatting and chart choices
|
Excel based Sales Dashboard by Martin (Option 22)
larger version |
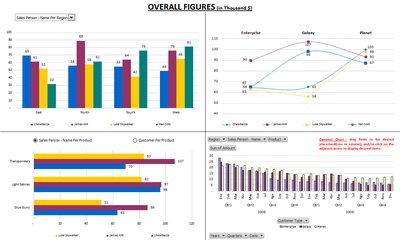
My Comments:
- Simple design with dynamic charts. Very good use of form controls and pivot charts to show data based on user selection.
- Very easily provides analysis on how sales person are doing in regions etc.
- Could include some messages.
|
Excel based Sales Dashboard by Matt Cloves (Option 23)
larger version |
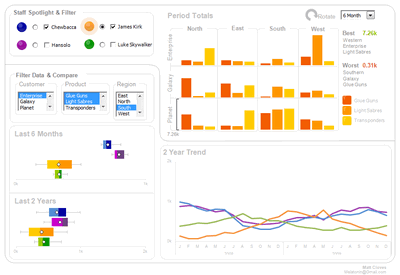
My Comments:
- Clever use of form controls. Very elegant design with clear colors and fewer charts.
- Good implementation of panel charts with ability to rotate so that comparison is easy.
- Focus on analysis from sales person point of view with overall trends and key messages. Very good design.
|
Excel based Sales Dashboard by Miguel (Option 24)
larger version |
My Comments:
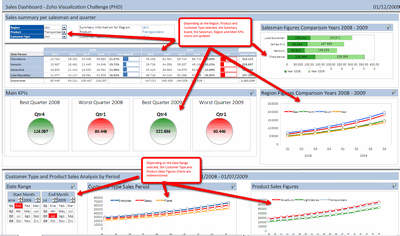
- Very intricate design with ability to select date ranges, dynamic filters and powerful drill-down of data.
- Tables show performance of sales persons clearly while key KPIs are highlighted.
- Fewer colors and charts. Easy to read and compare without loosing attention.
|
Excel based Sales Dashboard by Nick (Option 25)
larger version |
My Comments:
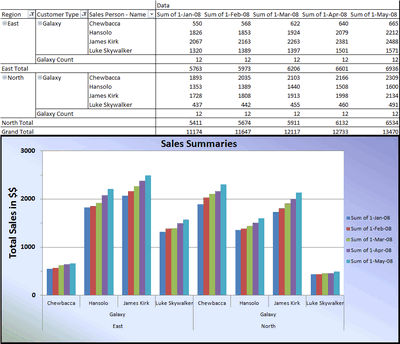
- Cleaver use of pivot tables and pivot charts.
- Relies on excel pivot features to provide required dynamic filtering of data.
- Pivot charts can be cluttered when all filters are reset.
|
Project Management Dashboards (recommended product)
 |
My Comments:
- Using My Excel Project Management Templates you can make dynamic project status dashboards from your data in few minutes.
- These templates make you better at project management and reporting.
|
Excel based Sales Dashboard by Pawel (Option 26)
larger version |
My Comments:
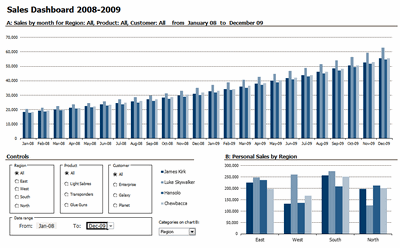
- Fewer colors and charts, elegant design with ability to filter based on region, product or customer. Also has the ability to select a date range to generate charts.
- Answers 2 key questions: (1) how are sales persons doing based on selected criteria (2) How are sales persons doing for the entire timeframe on selected criteria.
- Could include some messages.
|
Excel based Sales Dashboard by Pompadour (Option 27)
larger version |
My Comments:
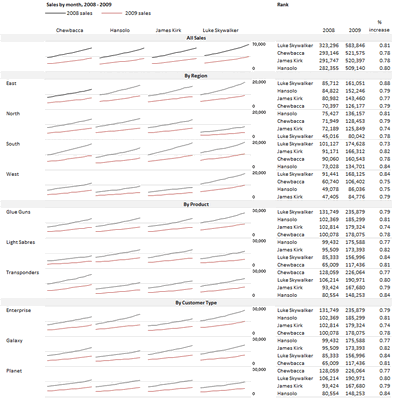
- Only 2 colors and just one chart type (lines on a panel chart).
- Provides comparison by region, product and customer type very easily.
- Could include some messages.
|
Excel based Sales Dashboard by Stephane (Option 28)
larger version |
My Comments:
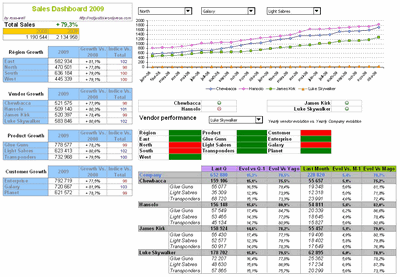
- Dynamic dashboard with ability to select region, customer and product.
- Uses tables and conditional formatting provide key data. Includes derived metrics like qtrly performance, comparison with previous year etc.
- Has only one chart to show overall sales person trend for the selected options.
|
Flot-Jquery-Ajax based Sales Dashboard by Steven Ng (Option 29)
larger version |
My Comments:
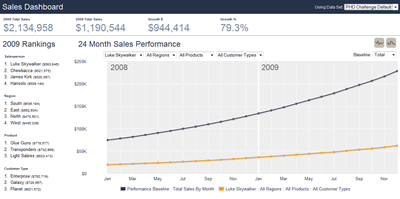
- Uses AJAX and Flot to generate the dashboard. Fewer objects and colors, so very easy to understand.
- Includes key messages (like rankings of regions, products etc. totals)
- Includes a dynamic chart to select sales person, region, product and customer. Also compares the selection against baseline (total sales by month etc.)
|
Excel based Sales Dashboard by Tessaes (Option 30)
larger version |
My Comments:
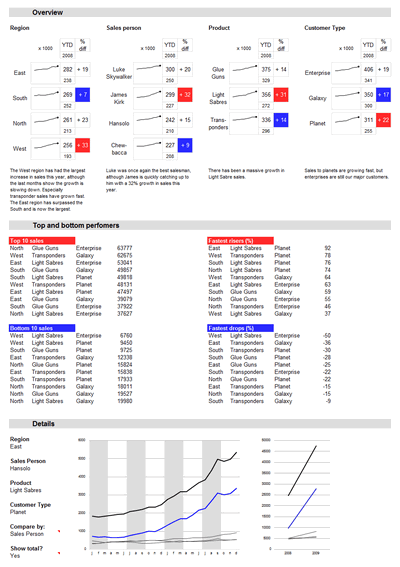
- Fewer colors (just 2) and clever use of line charts. Includes key messages and data tables to compare values against each other.
- Dynamic chart to show the performance of selected dimension by various filters like region, sales person, product or customer.
- The top and bottom performers table is very interesting. Cleaver design with attention grabbing colors.
|
Tableau based Sales Dashboard by Edouard (Option 31)
larger version |
My Comments:
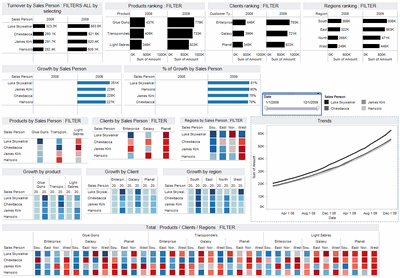
- Uses Tableau to generate a sales dashboard (requires tableau reader if you want to view this)
- Includes filters to choose date range, products, customers, regions and sales person. Includes several heatmaps to compare values instantly.
- Some charts can be improved (for eg. Growth by sales person has year 2008 with blanks, this is not required) Also heatmaps take sometime to understand.
|
Excel based Sales Dashboard by Faseeh (Option 32)
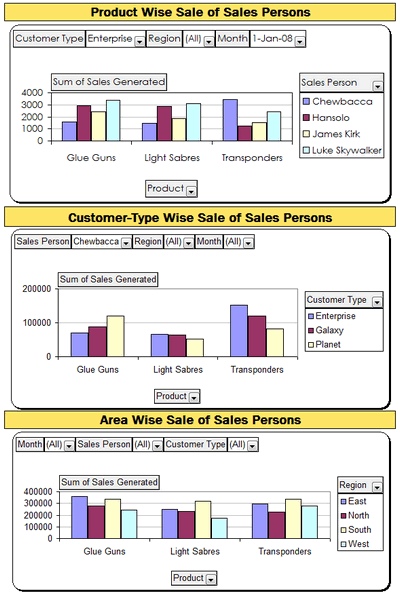
larger version |
My Comments:
- Uses excel pivot charts to show product, customer type and region-wise sales by sales person.
- Reader can easily filter values wanted using pivot features.
- Could use some more charts and messages.
|
Excel Dashboard Toolkit (recommended product)
 |
My Comments:
- Using Charley’s Excel Dashboard kit you can quickly and easily make excel dashboards from your data.
- I have personally tested and used this product and I find it extremely simple to use and can boost your productivity.
|
?DienDan.Edu.Vn cám ơn bạn đã quan tâm và rất vui vì bài viết đã đem lại thông tin hữu ích cho bạn. https://diendan.edu.vn/

DienDan.Edu.Vn Cám ơn bạn đã quan tâm và rất vui vì bài viết đã đem lại thông tin hữu ích cho bạn.DienDan.Edu.Vn! là một website với tiêu chí chia sẻ thông tin,... Bạn có thể nhận xét, bổ sung hay yêu cầu hướng dẫn liên quan đến bài viết. Vậy nên đề nghị các bạn cũng không quảng cáo trong comment này ngoại trừ trong chính phần tên của bạn.Cám ơn.


